Ramzi

RADDAOUI
Welcome to Ramzi RADDAOUI's website.
I'm a Machine Learning Engineer and I am currently
enrolled in Intelligent Systems & applications Master of Research program at Gustave Eiffel University.
Ramzi

RADDAOUI
Welcome to Ramzi RADDAOUI's website.
I'm a Machine Learning Engineer and I am currently
enrolled in Intelligent Systems & applications Master of Research program at Gustave Eiffel University.
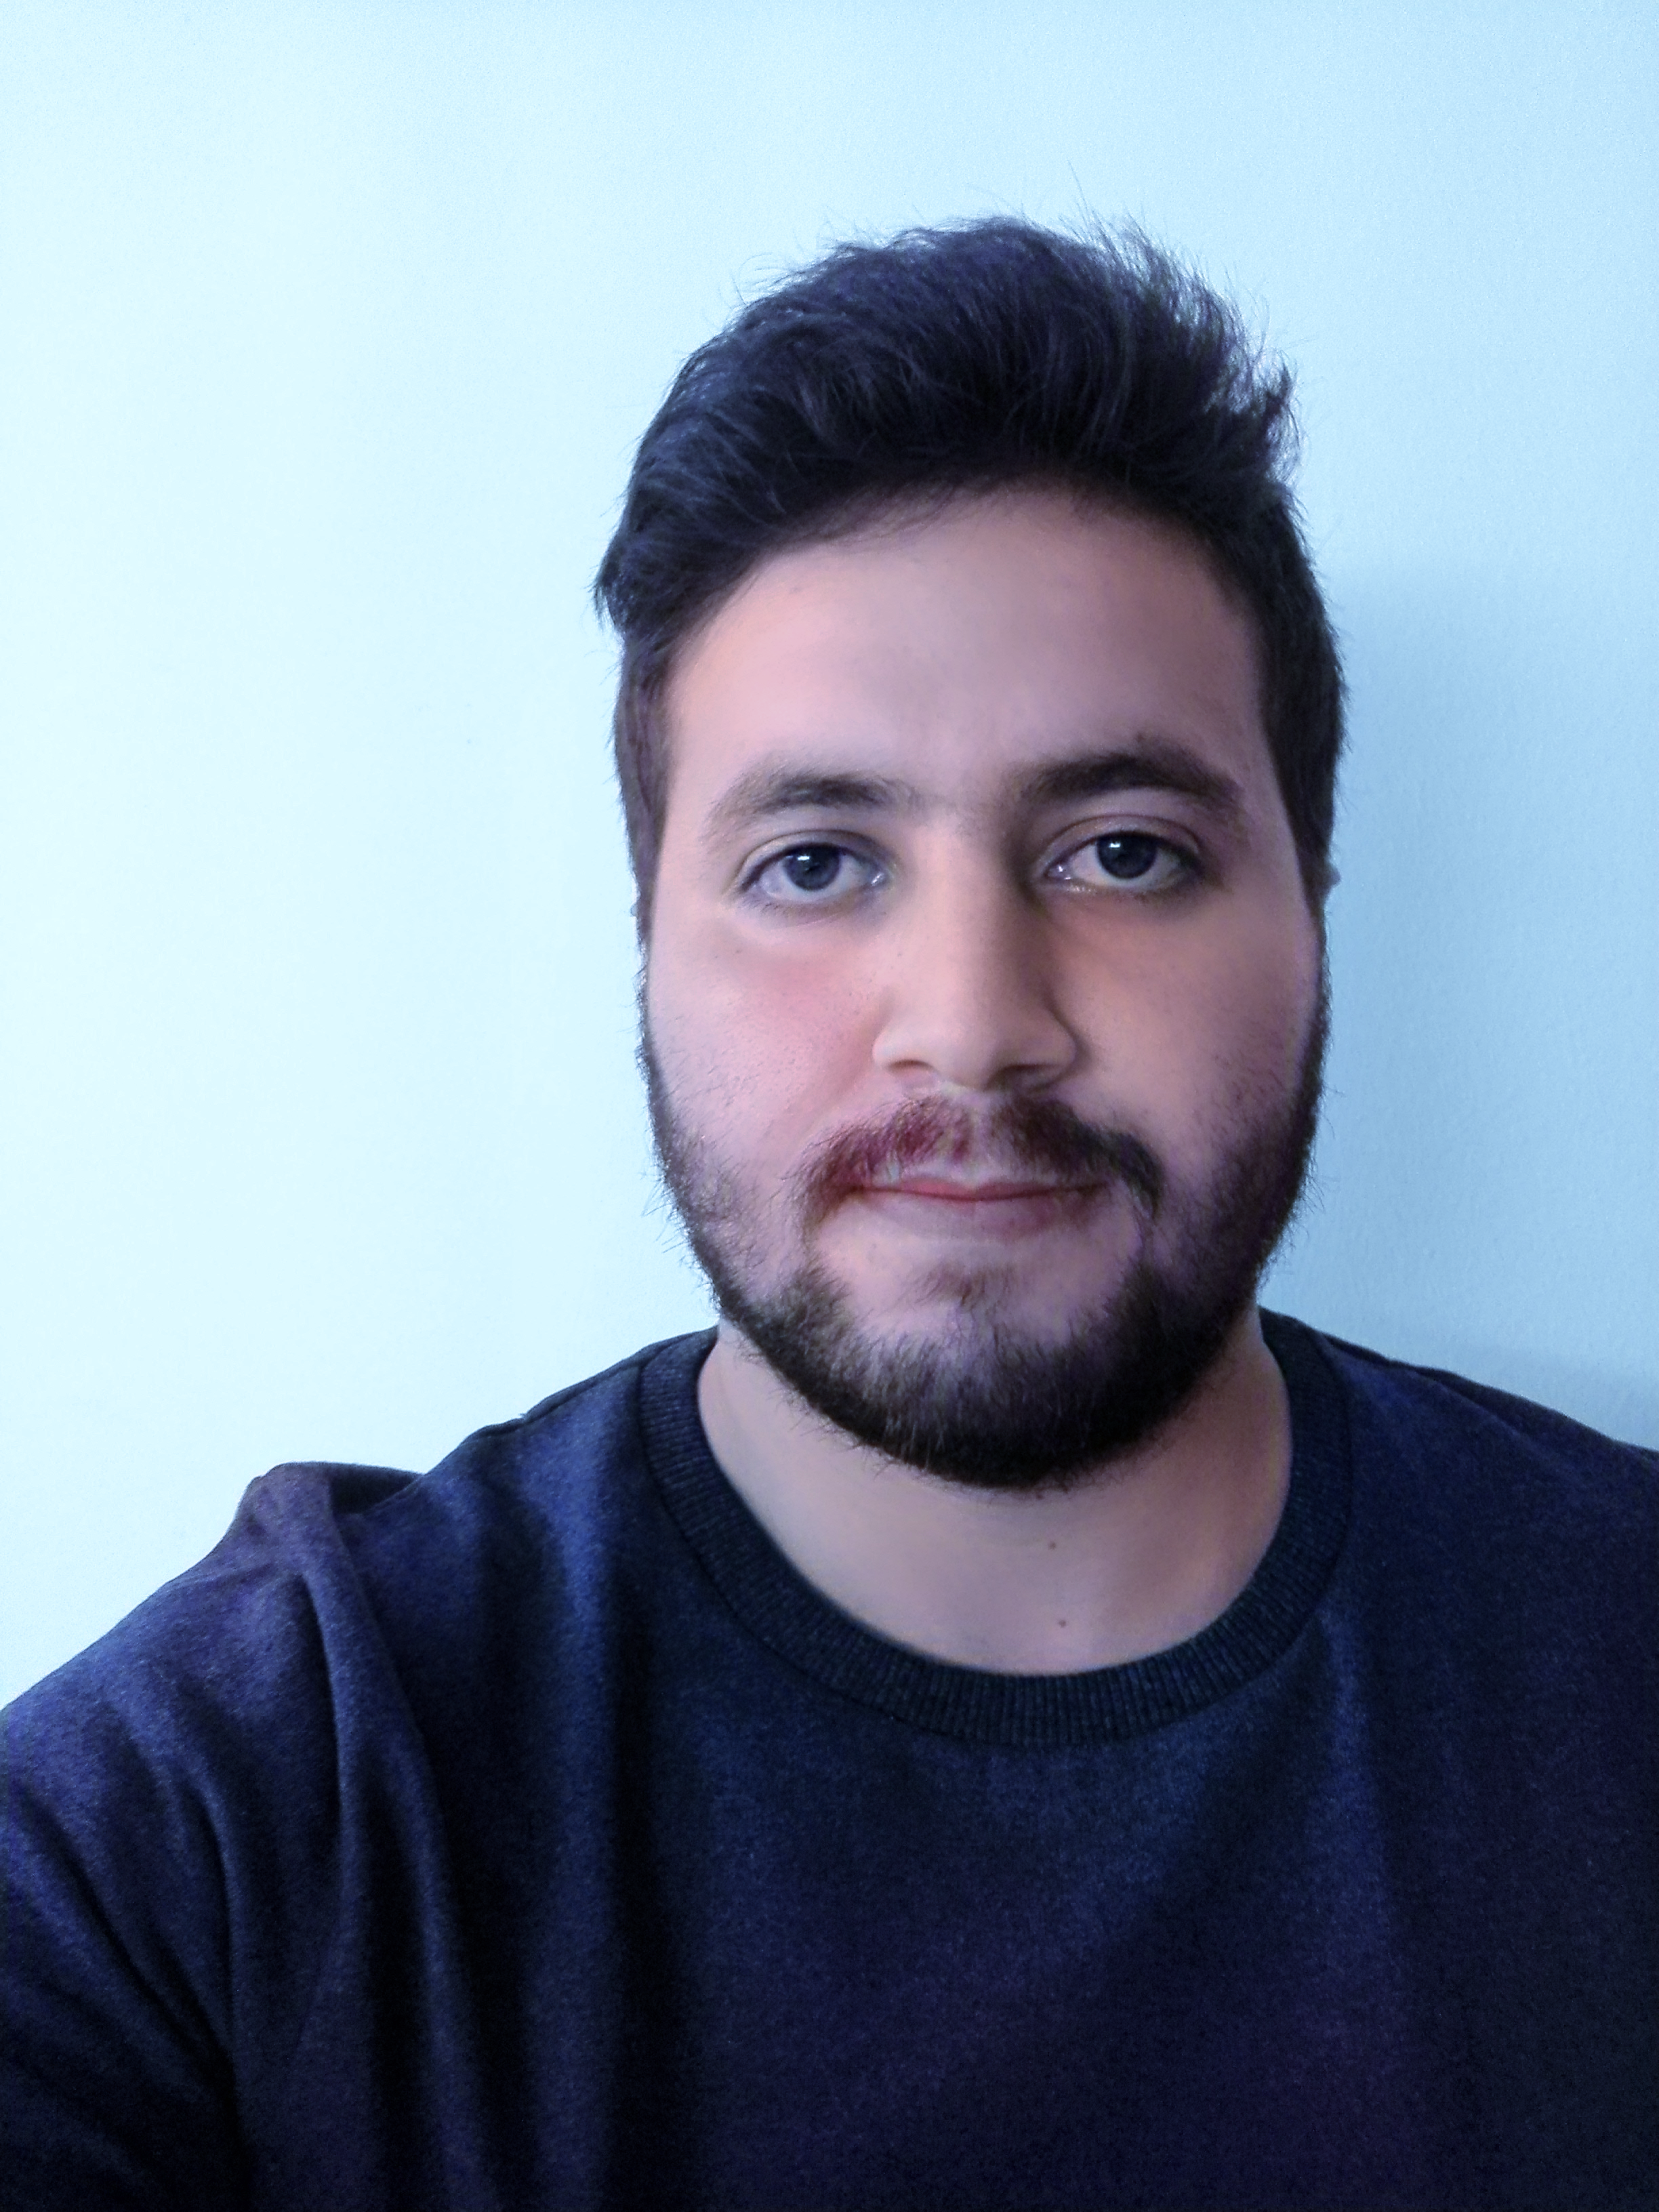
Hello World! I am Ramzi, a graduate student from Gustave Eiffel University in Intelligent Systems and Applications. I have also pursued a Master's of Engineering in Data Science and a Bachelor's degree in Mathematics and Computer Science both from the Private Higher School of Engineering and Technology. After seeing my favorite chess player Kasparov get beaten by IBM's Deep Blue, I have developed a strong attachment to computer science in general and intelligent systems in particular, and during my studies, I can say my interest in this field has only grown with time. I gravitate more towards Data Science and Data Analysis, with a huge enthusiasm for Computer Vision and Reinforcement Learning.
Projects Skills Twitter GithubSkills
A data project always start with a data enginering step. You need to harvest data and store it in an adequate format to be able to use it.
APIs, SQL
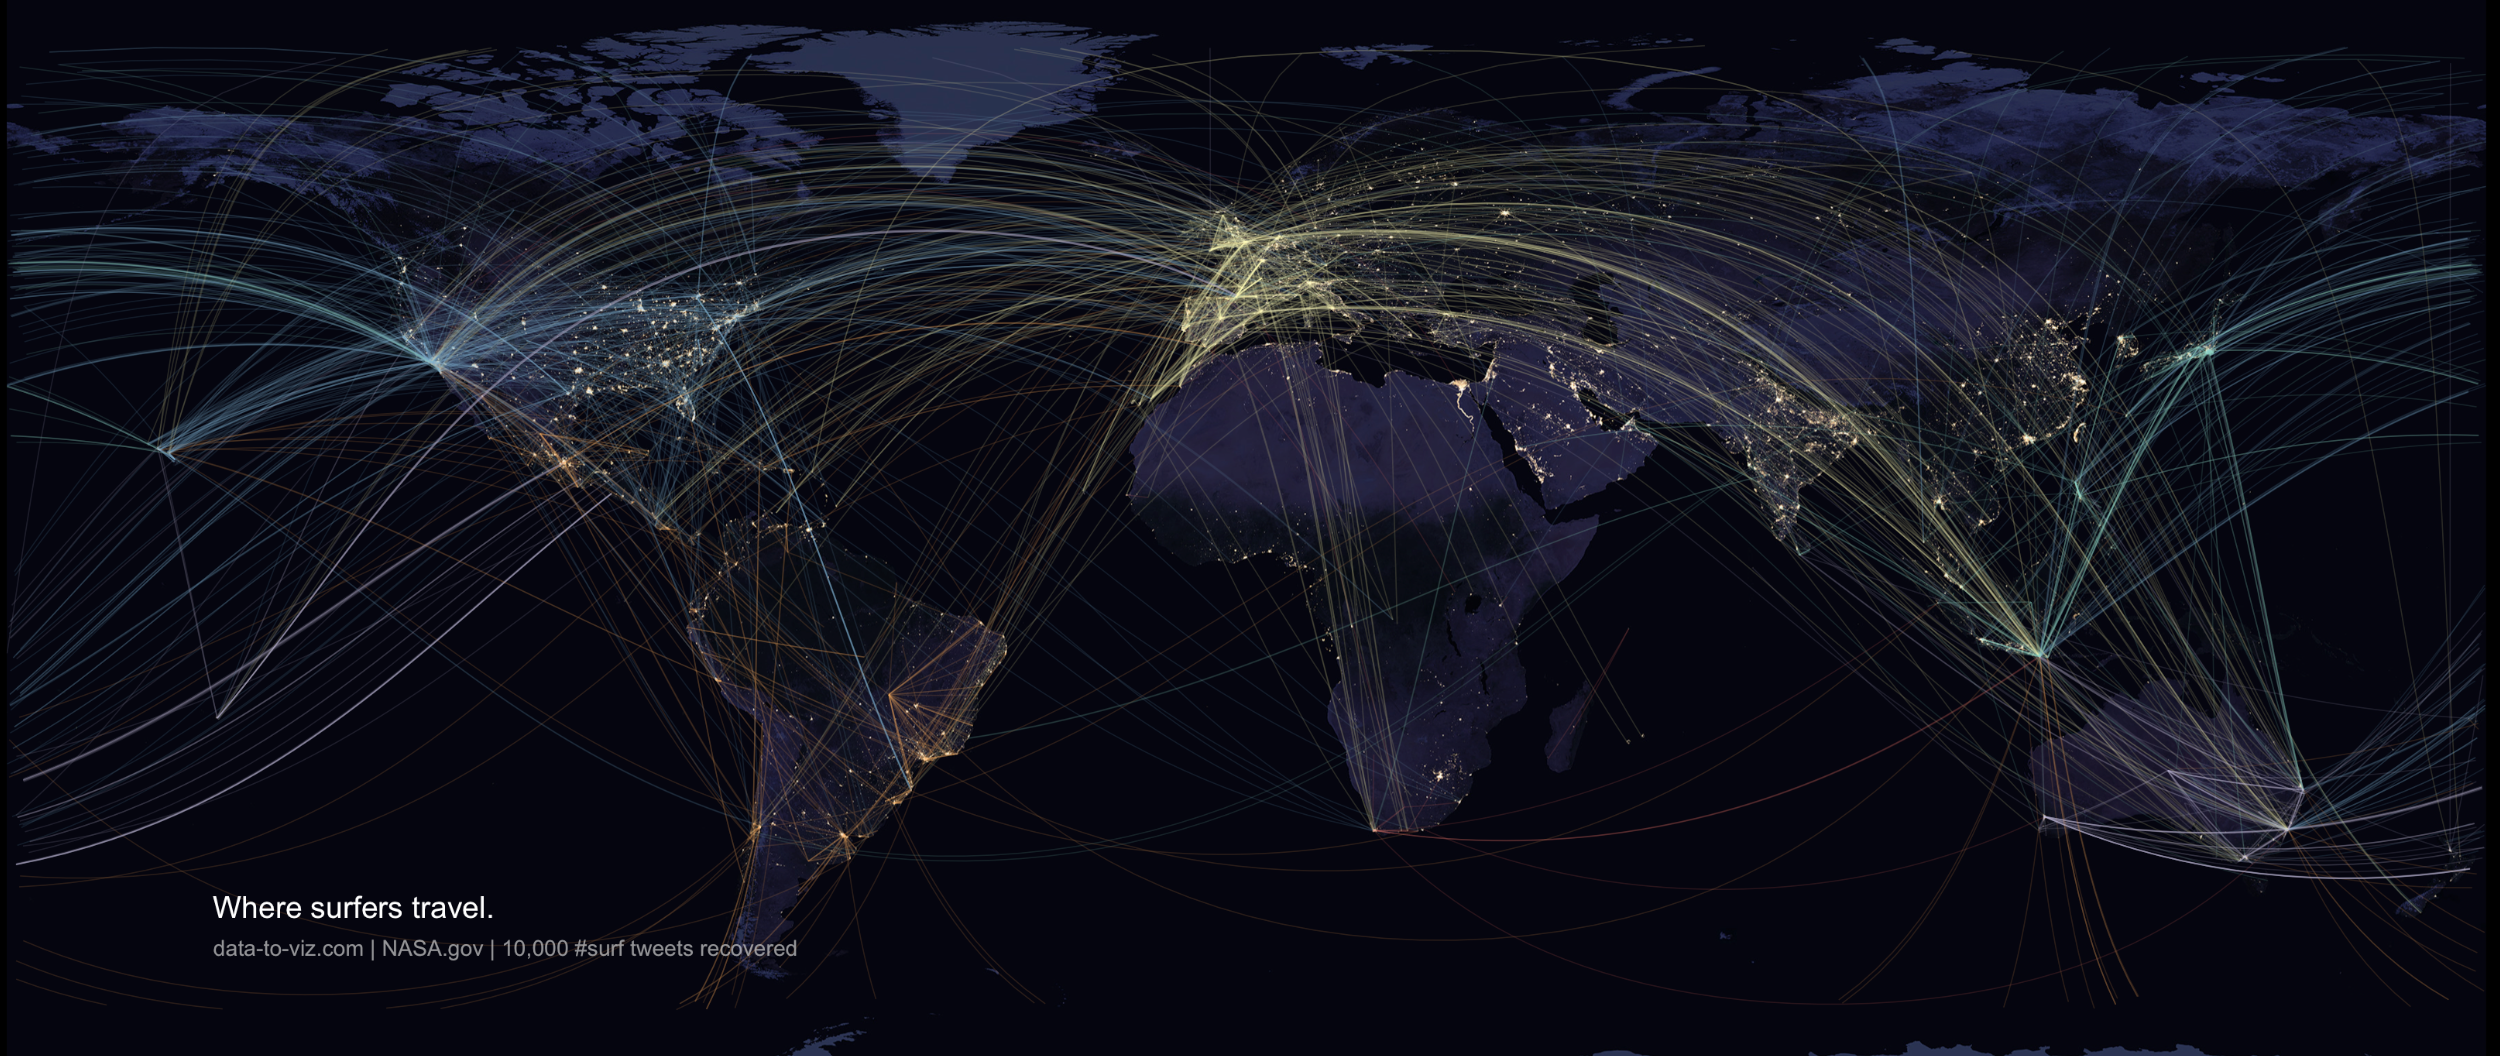
databases or messy Excel spreadsheets.#surf for 9 months to study how surfers use
social media. I used the twitter API and made the data collection automatic
thanks to a personnal webserver and a custom R script.dashboard for a company called Terres Inovia. It is directly
plugged on their SQL database and allows to access its information in real time.
Crunch the data to get answer to your question. Give insight to the information.
R Markdown.I'm a recognized expert in the field of dataviz. I've created several websites and given talks on this topic.
R and Shiny.d3.js.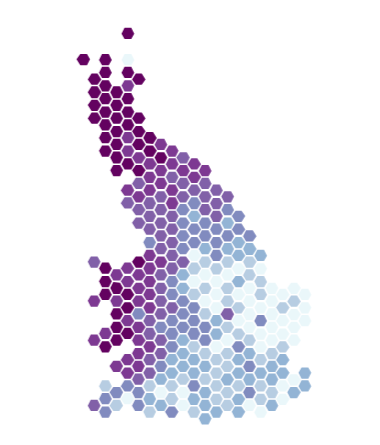
A web application allowing to visualize the geographical distribution of ~200 genetic related traits in the UK.
Online appA group of researcher from the Institute of Molecular Bioscience investigated the geographic clustering of genetic variants that influence complex traits and disease risk in a sample of ~450,000 individuals from Great Britain.
I built a web application that goes in support of the paper intitled Genetic Consequences of Social Stratification in Great Britain.

The shiny application allows to visualize the geographic distribution of any trait. It allows to custom color scales, region shape and to apply a cartogram algorithm to the map. Moreover, the tool allows one to upload its own data to benefit this dataviz tool.

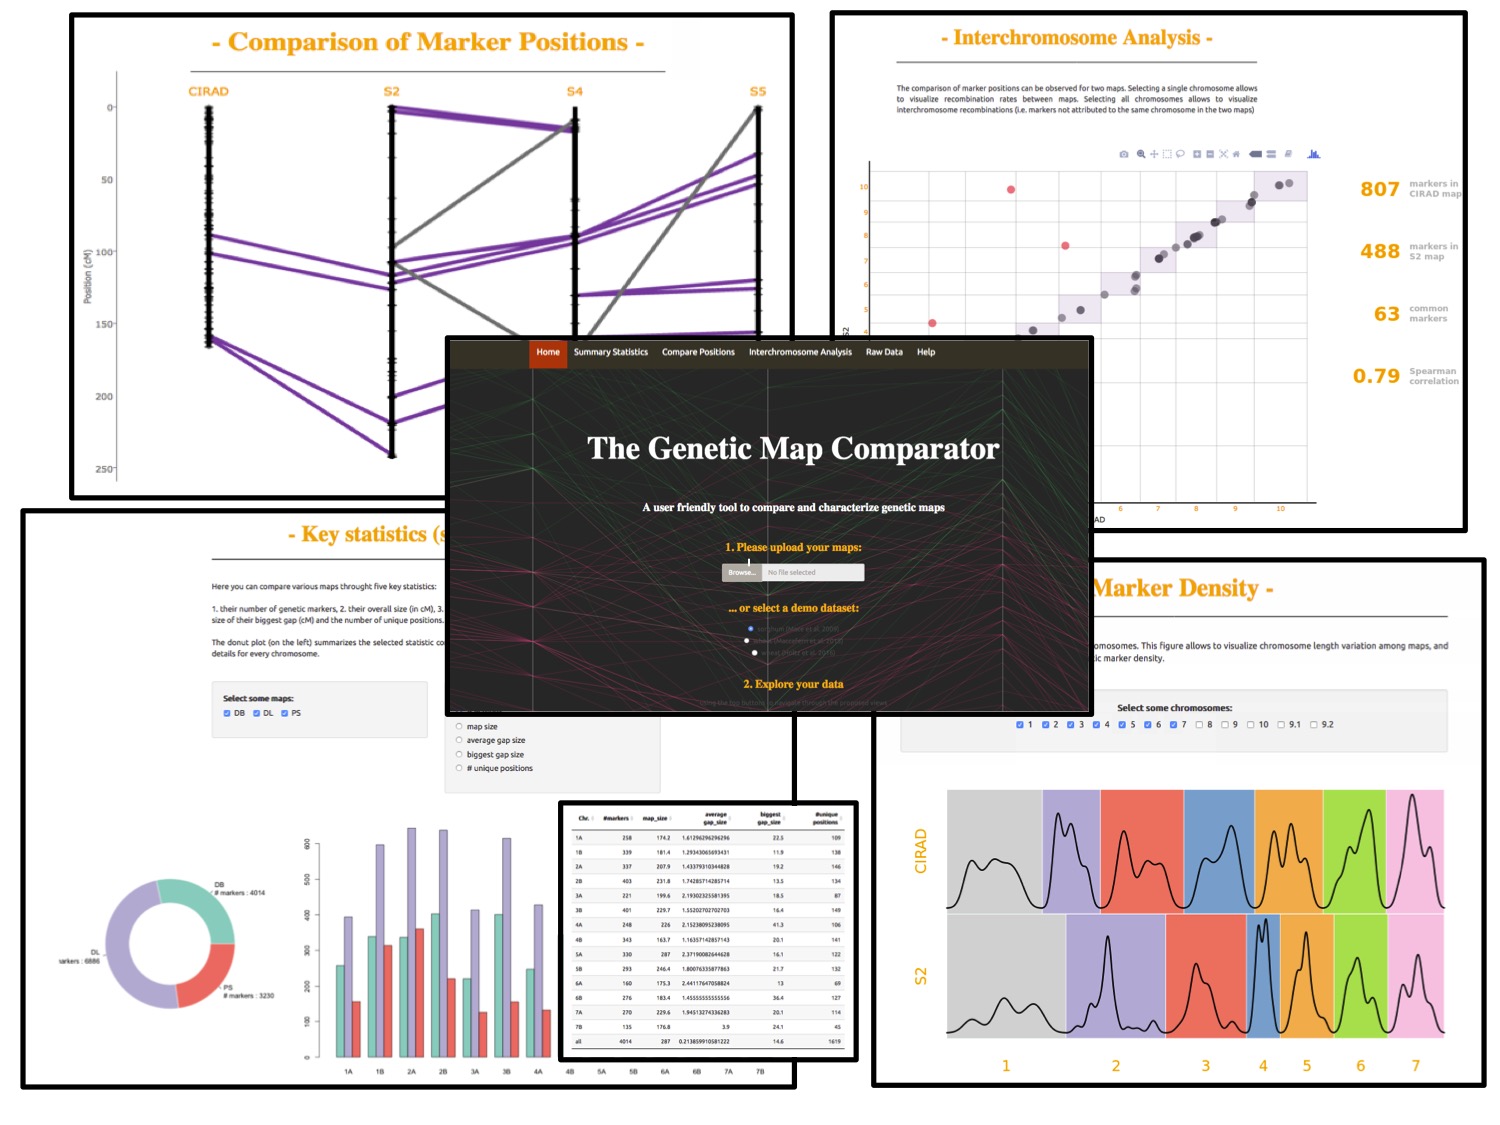
A web application made to compare genetic maps.
Online appBuilding and comparing genetic maps between several populations is a common task for geneticists.
We've created an online tool
allowing to upload your maps and characterize and visualize them. Several interactive graphs are
available with export options and more. The tool was created using R and
Shiny, plus several Html widgets for interactivity.
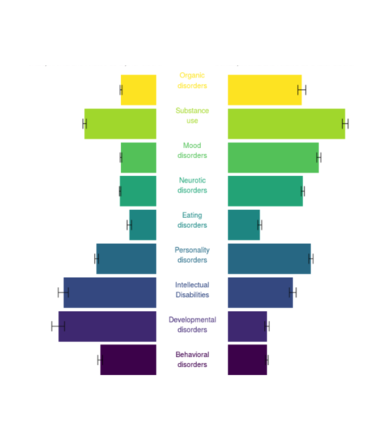
Visualizing the patterns of comorbidity within treated mental disorders.
Online appComorbidity is defined as the presence of 1 or more disorders in relation to an index disorder. I've been involved in a project with the Queensland Brain Institute (Australia) and the University of Aarhus (Denmark) to build an interactive website allowing to explore the discovered patterns of comorbidity between mental disorders.
The online tool goes with the
publication in Jama
Psychiatry. Several interactive graphs are available with export options and more. The
tool was created using R and Shiny, plus several
Html widgets for interactivity.


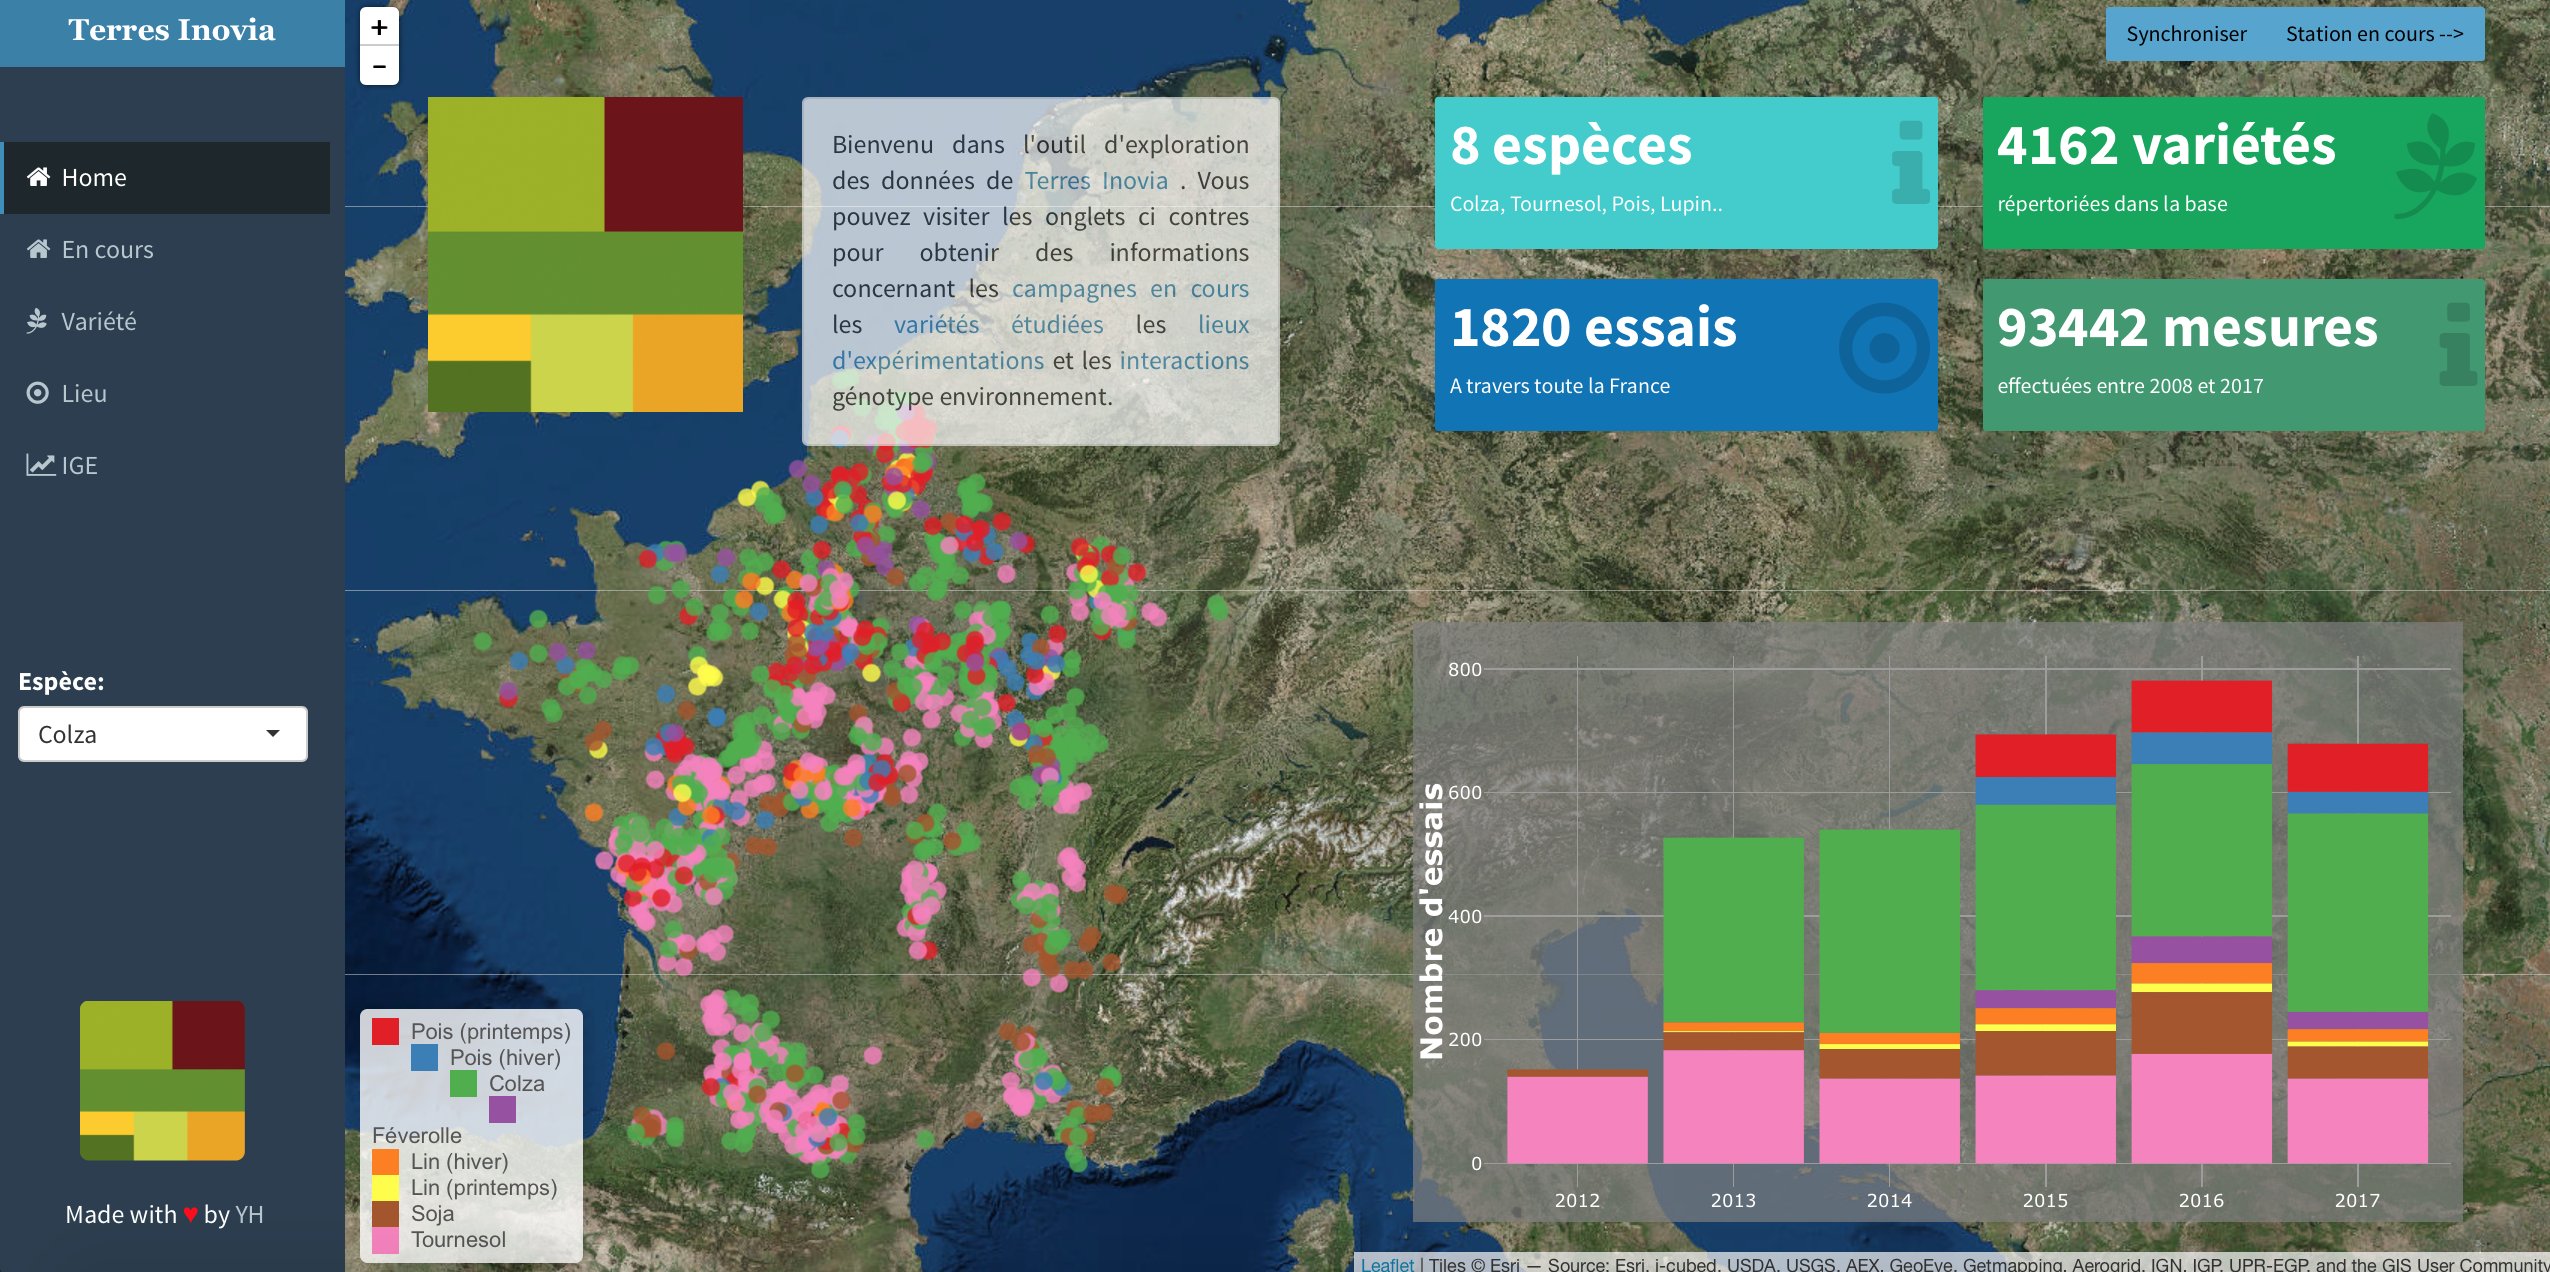
Creation of a dashboard to explore the database of a private company.
Terres Inovia is a French company carrying out applied
research on oilseed plants and protein crop. It phenotypes the main varieties of 20 crop species
in many locations for several traits every year. This information is stored in a massive
SQL database.
I created a dashboard allowing to explore these data. It allows to quickly
understand what variety performs well in what kind of environmental condition. It thus has a
direct impact on advices provided to farmer in France.
The dashboard was created using R and Shiny. It requires several
HTML widgets to create interactive graphs, and specific packages to interact with
the database. Here is a screenshot of the welcome page of the application:

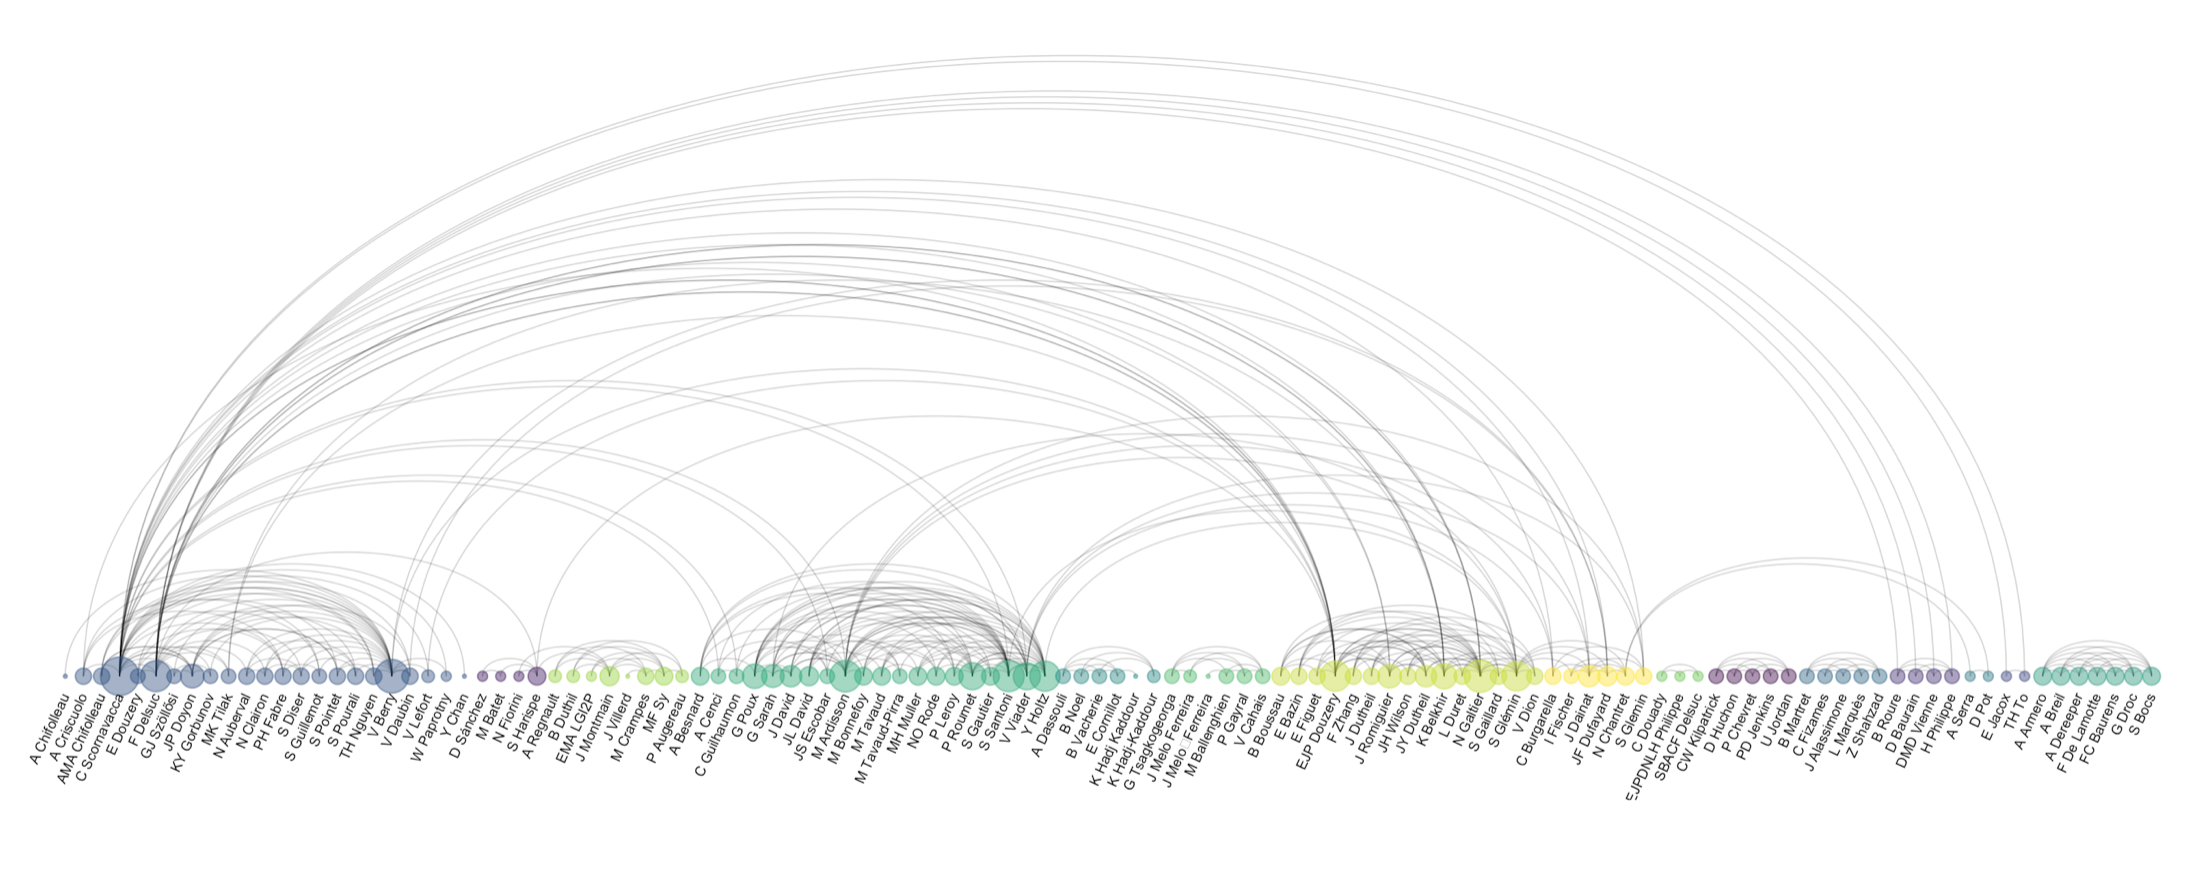
Google Scholar is a service that provides any researchers list of publication. I made a script
that harvest this information on the web using R. It then take the list of all
co-authors and check for each pair if they have published a paper together.
The network information is then visualized using static graphs with R, and also using interactive version thanks to d3.js
Studying water pollution for the French Ministery of environment.
Third price for this dataviz competition.
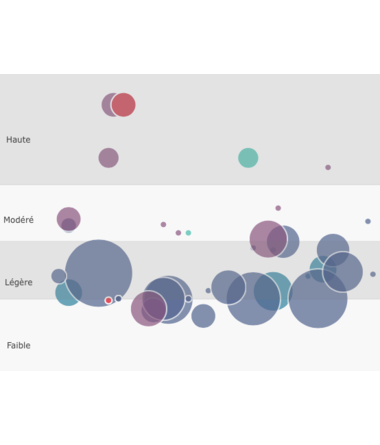
The GreenTech challenge is a Dataviz competition launched by the French Ministery of environment that took place in 2017. A huge dataset concerning pesticides in France has been released, and the goal was to build innovative visualizations to sensibilize and inform citizen concerning the french situation over the past 6 Years.
We decided to make a team of 4 friends and built a ShinyApp that allows to
efficiently explore this dataset. The app is composed by several sheets, each targeting a
specific theme. This tool should allow you to understand what happens in your neighbourhood and
in the entire country. It is also studied to improve your genereal knowledge concerning
pesticides.


Online tool to estimate standard error of allele frequency in pool-sequencing experiments.
Online appUNICS is a web app that helps you computing the standard error of allele frequency estimations of future pool-sequencing experiments based on different parameters. You can use it trough the online version and read the related publication.
Application looks like this:


I recovered tweets containing #surf for 9 months. Here is where surfers travel.
I created an R script that recovers all tweets containing the hashtags
#surf and run it on a webserver for about 9 months. I recovered more than 400k
tweets. Some of them being geolocalized for both home and current location, it is possible to
deduce where surfers travel.
Here is an overview of the result:
